Anomaly detection is considered essential for academic research and industrial practice. It is employed for a broad range of purposes, including fraud detection, data quality analysis, security scanning, and system and process monitoring. The concept of the anomaly, however, has remained vague. Now, Dr Ralph Foorthuis, Global Domain Architect Data at HEINEKEN, defines the anomaly and provides a complete overview of its types and subtypes. His novel typology can be used to evaluate unsupervised anomaly detection algorithms and understand and explain the findings of data analyses.
Anomalies are unusual occurrences in datasets that in some way differ from the rest. They do not fit the overall patterns. Two hundred and fifty years have passed since Bernoulli first published his initial research into anomalies, yet the notion of the anomaly remains vague and no complete overview of the various types of anomalies has been published – until now. In his recent publication ‘On the Nature and Types of Anomalies: A Review of Deviations in Data’, Dr Ralph Foorthuis, Global Domain Architect Data at HEINEKEN, defines the concept of the anomaly and offers a comprehensive overview of all anomaly types and subtypes.
The process of analysing data to identify such atypical occurrences, known as anomaly detection, is considered essential for both academia and industrial practice. It is used for a broad range of purposes, including fraud detection, security monitoring, data preparation, data quality analysis, novelty discovery, and system and process control. Foorthuis describes how ‘despite abundant research and valuable progress, the field of anomaly detection cannot claim maturity yet. It lacks an overall, integrative framework to understand the nature and different manifestations of its focal concept, the anomaly’. His first step in filling this void was to conduct an extensive review of the literature to underpin the typology and provide an overview of the different anomaly types from prior research.
Defining the anomaly
In its simplest sense, an anomaly is uncharacteristic and different to what is expected. Sometimes, it is referred to as an outlier, deviant, novelty, or discord. In statistics, data mining, and artificial intelligence (AI), it digresses from what is deemed to be normal in terms of the data. Foorthuis’ study focuses on data anomalies that can be detected using unsupervised algorithms; thus, it is based on the intrinsic properties of the data rather than on prior knowledge, decisions, or model training. In this context, he explains, an anomaly can be defined more precisely: it ‘is a case, or a group of cases, that in some way is unusual and does not fit the general patterns exhibited by the majority of the data’.

A typology of anomalies
Where a classification employs only one dimension to distinguish between relevant elements, a typology uses two or more dimensions simultaneously. This makes it a suitable vehicle to discriminate between complex concept types. Along with presenting a fundamental and summarised description of the general concept, this innovative typology of anomalies provides a thorough and mutually exclusive overview of the separate but related anomaly types.
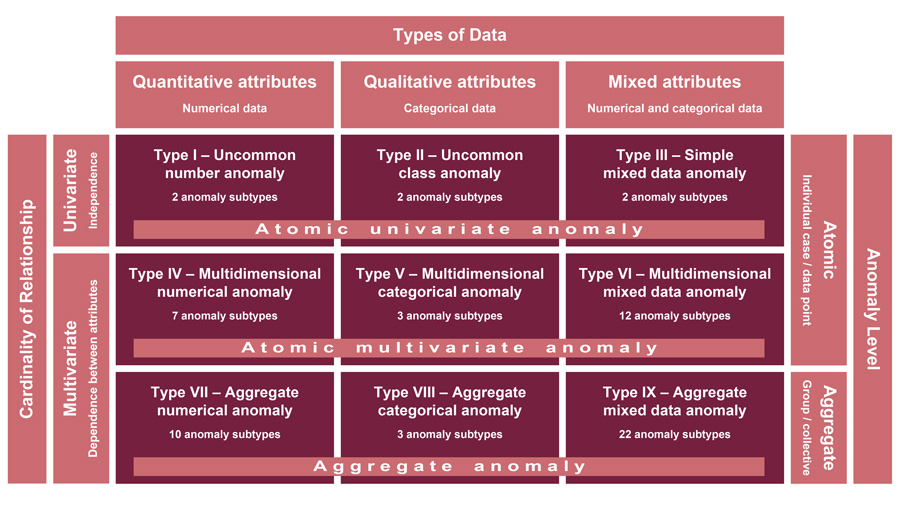
Foorthuis defines the idea of the anomaly using five fundamental data dimensions that define both the types and subtypes of anomalies. These are data type, cardinality of relationship, anomaly level, data structure, and data distribution. Three key dimensions – data type, cardinality of relationship, and anomaly level – are depicted in the visual framework in Figure 1. They each represent a definitive principle describing a fundamental characteristic that distinguishes between the three groupings of anomalies and divides them into nine rudimentary anomaly types.
“The value of the typology lies in offering a theoretical yet tangible understanding of the concept of the anomaly and its manifestations.”
Fundamental data dimensions
Data type describes the variables capturing the anomalous behaviour as either quantitative (numerical) in nature, qualitative (categorical), or mixed with both numerical and categorical attributes.
Cardinality of relationship characterises how the different attributes relate to each other when they describe deviant behaviour. There can be multivariate dependence between attributes that are jointly accountable for the irregular behaviour, or univariate independence where attributes are individually responsible.
Anomaly level distinguishes between atomic anomalies that are singular cases or data points, and aggregate anomalies, manifesting themselves as groups or clusters.
The remaining dimensions – data structure and data distribution – are used to differentiate between the anomaly subtypes contained in the cells of the framework. For example, anomalies manifest themselves differently in data structures such as time series, graphs, images, videos, and cross-sectional and spatial data formats. Using these five data-oriented dimensions to define the data anomaly, Foorthuis provides an overview of three broad groups of anomalies made up of nine basic types and 63 subtypes. He has also published data plots and real-world examples of many anomaly types and subtypes using data from the Polis Administration, an official register with master data of the salaries, social security benefits, pensions, and income relationships of people in the Netherlands.
The value of the typology lies in offering a theoretical yet tangible understanding of the concept of the anomaly and its manifestations, assisting researchers with evaluating detection methods, and contributing to explainable anomaly detection. The video Taming the Anomaly uses data plots and animated examples to provide an accessible overview of the different types of anomalies.
Evaluation of anomaly detection algorithms
This typology of anomalies is intended to facilitate the systematic evaluation of the functional capabilities of unsupervised anomaly detection algorithms. Foorthuis explains that with the broad assortment of anomalies, individual algorithms are unable to identify all types. Researchers can use his predefined typology to state which types and subtypes of anomalies can be detected, thus providing objective insights into their anomaly detection algorithms’ functional capabilities. The typology can also be used to ensure that the relevant anomaly (sub)types are injected into the test dataset.
Explainable anomaly detection
Many anomaly detection algorithms can detect multiple subtypes and generate anomaly scores or labels, but they do not provide explanations as to how a particular anomaly differs from the majority of the data. The framework explains the nature of the identified anomaly, describing how it deviates from normal cases with regard to its main data characteristics.
“High-density anomalies are especially pertinent in misbehaviour detection.”
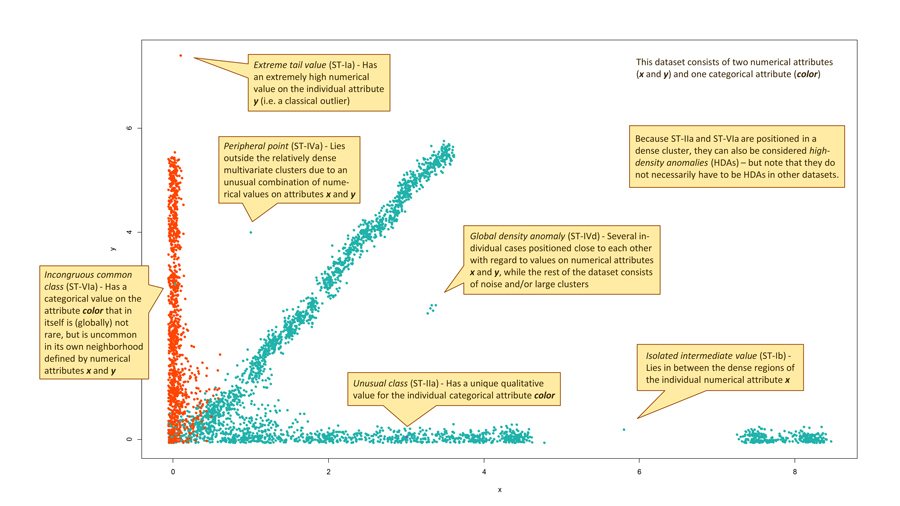
For example, a general-purpose anomaly detection method may be able to detect 12 anomaly subtypes. This obviously covers a wide variety of data deviations, which warrants further analysis to understand the black box results. The typology can be employed to explain each anomalous occurrence in terms of the (sub)type it belongs to and the five dimensions that describe the nature of the deviation. Figure 2 provides some examples. Understanding the anomaly is valuable as a goal of its own, but it is also a requirement if follow-up actions are taken, such as acting upon suspicious behaviour or implementing automated checks in systems.
High-density anomalies and other conceptual variations
Not all anomalies are the traditional, isolated occurrences in low-density areas. For example, they can be different in terms of only one or two of their attributes and exhibit normal behaviour with regards to the other variables. Detecting such cases can unmask misbehaviour. For example, when attempting to commit fraud, people or organisations will try to keep their actions close to normal, legitimate actions.
Foorthuis has discovered another such variation, the high-density anomaly. This anomaly occurs in a highly normal neighbourhood. High-density anomalies differ from the norm but occur in relatively high-density regions of the data space. They hide among the most normal data points. High-density anomalies are especially pertinent in misbehaviour detection or when the dataset contains a lot of noise. Their identification entails resolving a delicate balancing problem where anomalousness and normalness must both be considered. Traditional anomaly detection algorithms do not usually detect them, but if they are recognised, they will only be assigned a modest anomaly score.
SECODA
Foorthuis has also developed SECODA (SEgmentation- and COmbination-based Detection of Anomalies), an anomaly detection algorithm for mixed data. He has deliberately kept SECODA simple, restricting it to basic data operations, control flows, and set-based actions to demonstrate that complex anomalies can be detected by a relatively simple algorithm. It also allows practitioners to implement the algorithm on basic platforms that do not offer support for advanced analytics. Furthermore, it allows for in-database analytics, so the data in the database can be analysed with SECODA, avoiding the need to export the data to another analytics application. SECODA has no need for resource- and memory-intensive point-to-point calculations, can deal with all kinds of relationships between attributes, is able to analyse very large datasets, has no problem with missing values or duplicate cases, and could be implemented for parallel processing architectures. This all has positive effects on time performance and security. Foorthuis presents an evaluation of SECODA using data from the Polis Administration that demonstrates how SECODA, and anomaly detection in general, can be deployed to improve data quality.
The broader perspective
This research reveals that in addition to the algorithms and the anomaly detection process, academics and practitioners should consider using a data-centric approach to analyse anomalies – and not focus solely on algorithms and/or domain knowledge. This will aid their understanding of the data and could provide opportunities to explore new knowledge. Foorthuis suggests that the bigger picture of anomaly analysis and detection should be embraced rather than limiting the field to anomaly detection. ‘After all, in addition to detecting anomalies it is important to understand and explain why a given occurrence is anomalous, especially because follow-up actions are often required to manage the identified deviations.’
The incredible richness of the field proved to be a significant challenge. Early versions of the framework and anomaly types were published in 2017 and 2018. When presenting the typology at the IPMU 2018 conference, I got some valuable feedback. I assumed then it would take only a couple of months to finish my work, but it actually demanded a couple of years! The field is simply too complex and too extensive for it to be quickly mapped. Being active as a practitioner was another complicating factor, leading to lots of struggles with time and my personal life… But I always felt this was an important research project. ‘On the Nature and Types of Anomalies’ is essentially the publication that I searched for many times because I needed it for my evaluations of detection methods, and always thought I would find it eventually. But I didn’t, and I’m still surprised that nobody apparently thought of doing this before.
See the video Taming the Anomaly for an accessible overview of anomaly types by means of data plots and animated examples.
References
- Foorthuis, R M, (2021) On the Nature and Types of Anomalies: A Review of Deviations in Data. International Journal of Data Science and Analytics, 12(4), 297–331. doi.org/10.1007/s41060-021-00265-1
- Foorthuis, R M, (2020) Algorithmic Frameworks for the Detection of High-Density Anomalies. 2020 IEEE Symposium Series on Computational Intelligence (SSCI), 2067–2076. doi.org/10.1109/SSCI47803.2020.9308417
- Foorthuis, R M, (2019) All or In-cloud: How the Identification of Six Types of Anomalies is Affected by the Discretization Method. In: Atzmueller, M, Duivesteijn, W, (eds) Artificial Intelligence. BNAIC 2018. Springer, Communications in Computer and Information Science, 1021, 25–42. doi.org/10.1007/978-3-030-31978-6_3
- Foorthuis, R M, (2018) A Typology of Data Anomalies. In: Springer CCIS 854, Proceedings of the 17th International Conference on Information Processing and Management of Uncertainty in Knowledge-Based Systems (IPMU 2018), 854. Springer, Cham. doi.org/10.1007/978-3-319-91476-3_3
- Foorthuis, R M, (2017) SECODA: Segmentation- and Combination-Based Detection of Anomalies. In: Proceedings of the 4th IEEE International Conference on Data Science and Advanced Analytics (DSAA 2017), 755–764. doi.org/10.48550/arXiv.2008.06869
- Bernoulli, D (1777, 1961) The most probable choice between several discrepant observations and the formation therefrom of the most likely induction. In: Transl by C.G. Allen, Biometrika, 48(1–2), 3–18 (1777) (The original was published in Latin in Acta Acad. Petrop.) doi.org/10.1093/biomet/48.1-2.3
10.26904/RF-141-2648675378
Research Objectives
Understanding the essence of anomalies and the way they manifest themselves in data, as well as introducing novel anomaly types and detection methods.
Funding
- HEINEKEN D&T (Digital & Technology)
- Loonaangifteketen
- UWV
Bio
Dr Ralph Foorthuis is currently Global Domain Architect Data at HEINEKEN, focusing on data management, analytics, and data models. He published academic research in the fields of Advanced Analytics and Information Systems. Dr Foorthuis received his PhD from Utrecht University with the thesis ‘Project Compliance with Enterprise Architecture’. Recent research focuses on anomaly detection algorithms and concepts.

Contact
![]()
E: ralph.foorthuis@heineken.com
T: +31 630827572
W: www.foorthuis.nl